 Manufacturing
 Retail y bienes de consumo
 Salud y farmacéutica
X-DATA
About us
DATA ANALYTICS STUDIO
We are the #1 Data Analytics Studio in Mexico. We create solutions tailored to the challenges of your organization so that you unleash the potential of your data and use it to your advantage

We transform data into assets
We encourage your company to make better decisions based on data so that it can scale to new levels of productivity, efficiency and savings.
We turn data analysis into the backbone of your organization, developing a competitive advantage over your rivals in the market.

Results in 40 days
We evaluate the level of use of your company's data and help you find the ideal route to solve your challenges. We are committed to delivering tangible results in less than 40 days thanks to the iterative process that we have developed with our talented team.

Dataviz
We take your data, analyze it and visualize it in dashboards that allow you to better understand what is happening with your company, identify problems or advantages and start making better informed and strategic decisions.

Break information silos
We are committed to grouping data, even those that are isolated, to find relationships and insights that become useful information and finally actions that transform your company into a totally data-driven organization.
Solutions - productos and services

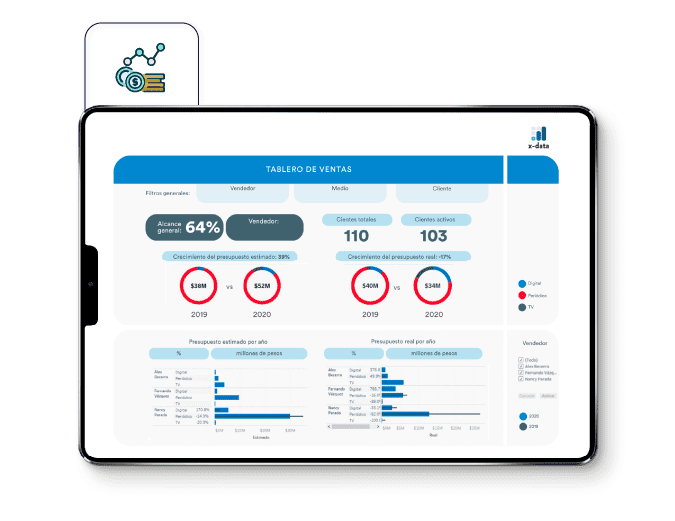
Dashboards
Take control of your business using tools that allow you to monitor your business information in real time. Make decisions based on hard data, supported by easy-to-read dashboards. Discover valuable insights within your information and empower your entire company with them.

Dataviz
Show your audience complex data sets in an engaging and easy-to-digest way. Data visualization is the intersection between the science and art of displaying information, which makes it much easier to identify key insights.
Advanced Analytics
Centralize and analyze your organization's data to identify business opportunities and solve problems. Let the data speak for itself and show you how your market is performing.

Data architecture consulting
Your company generates large volumes of data and processing them is a challenge that we help you solve. Join the industry's best practices for storing and structuring information, allowing you to have greater scalability and collaboration in data warehouses.
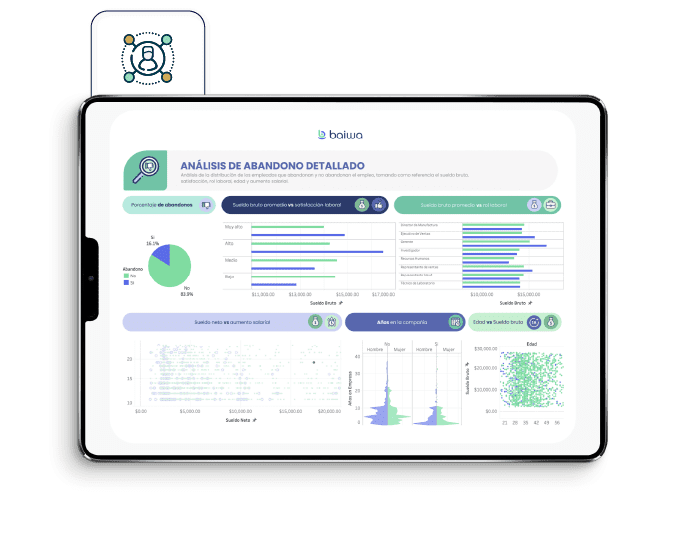
Baiwa
Transform your Human Resources area into a data driven one. Design your strategy using technological resources where you contemplate the needs of your company and your employees. Reduce turnover, hire intelligently and promote valuable assets within your organization.

Data Lake
All your data in one place. Create a repository to store, manage, index and dispose of all the structured or unstructured data you generate, in a simple and automatic way; with the capacity to digest high volumes of information.

Energy Map
Through an executive dashboard, it monitors in real time the price of electricity, natural gas and other factors that may alter these indicators, such as the exchange rate, CPI, etc.
success stories
Logistics and transportation
We analyze delivery logs and consumption patterns to identify the ideal delivery time for each customer.
20% less km traveled monthly
Reduction of false deliveries
Short-term return on investment
Success stories
People Analytics
With Baiwa we analyze the data of the collaborators and find patterns to identify the characteristics of the ideal profile for the organization, in order to attract and hire key talent.
17% reduction in turnover in 3 months
Audit tool in recruitment area
Increased efficiency and creation of KPIs
success stories
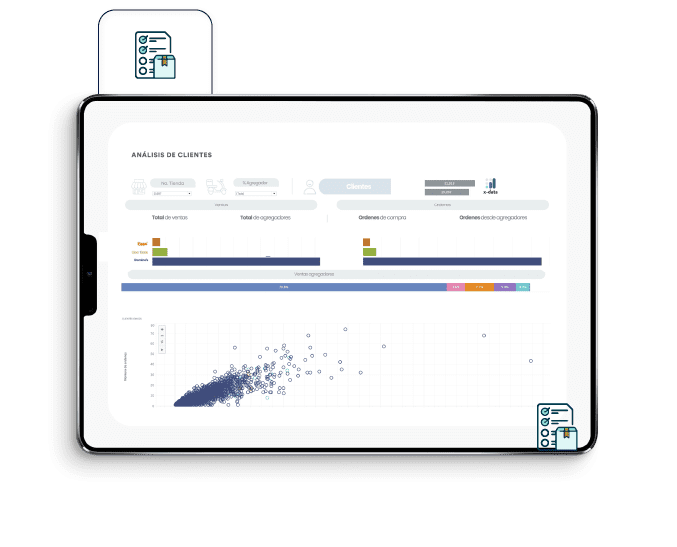
Retail and consumer goods
We built a predictive analytics tool to measure demand and identify which products are needed in inventory. Plus, a warehouse inventory tool to identify overages and shortages to seek coverage with other warehouses in the same chain.
30% more sales (SKU)
15% fewer trips to transport merchandise
Products with 40% less time in stock
Dataviz
Data Visualization
At x-data we are experts in data visualization. Data is everywhere and can be represented in a very attractive way that is easy to understand and analyze depending on the target audience.
We show you some visualization projects that we have carried out with our allies:.
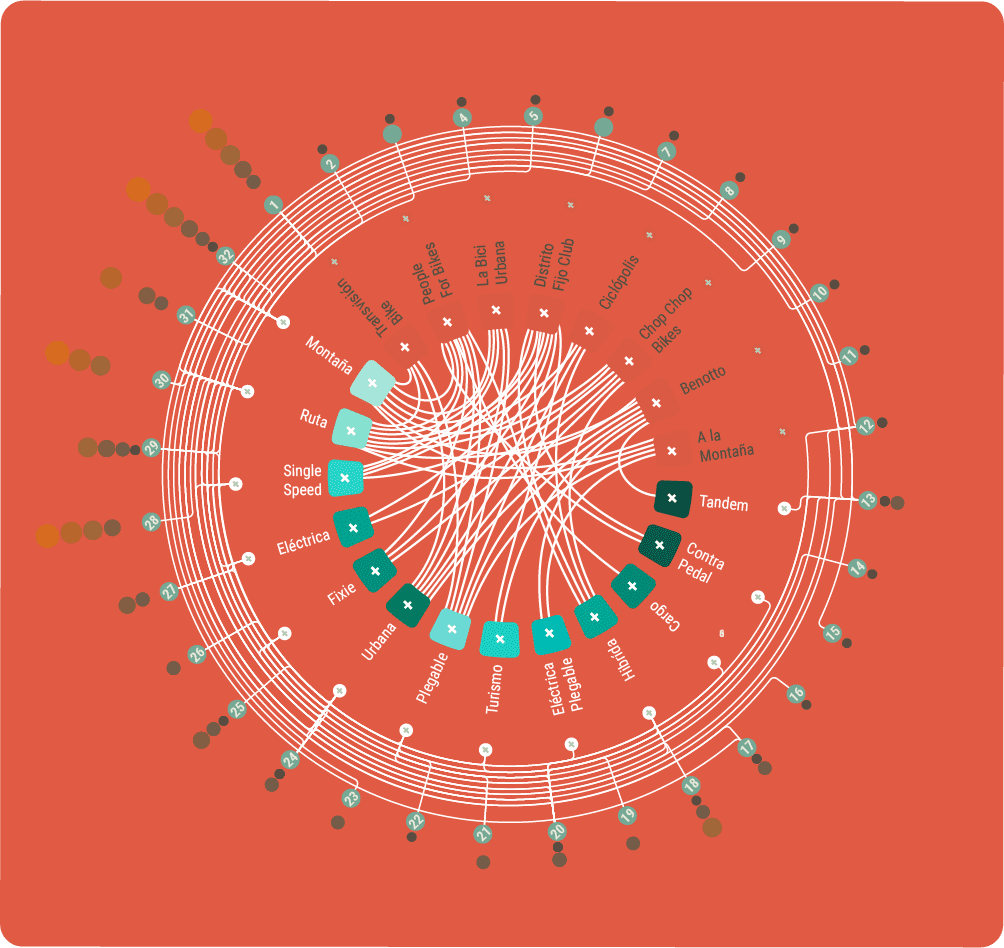

Contrapedal / X-DATA
We made a platform with D3 visualizations to demonstrate that data analysis and visualization can boost cycling mobility. We created a unique consultation space where all the information necessary to ride safely in CDMX is found.
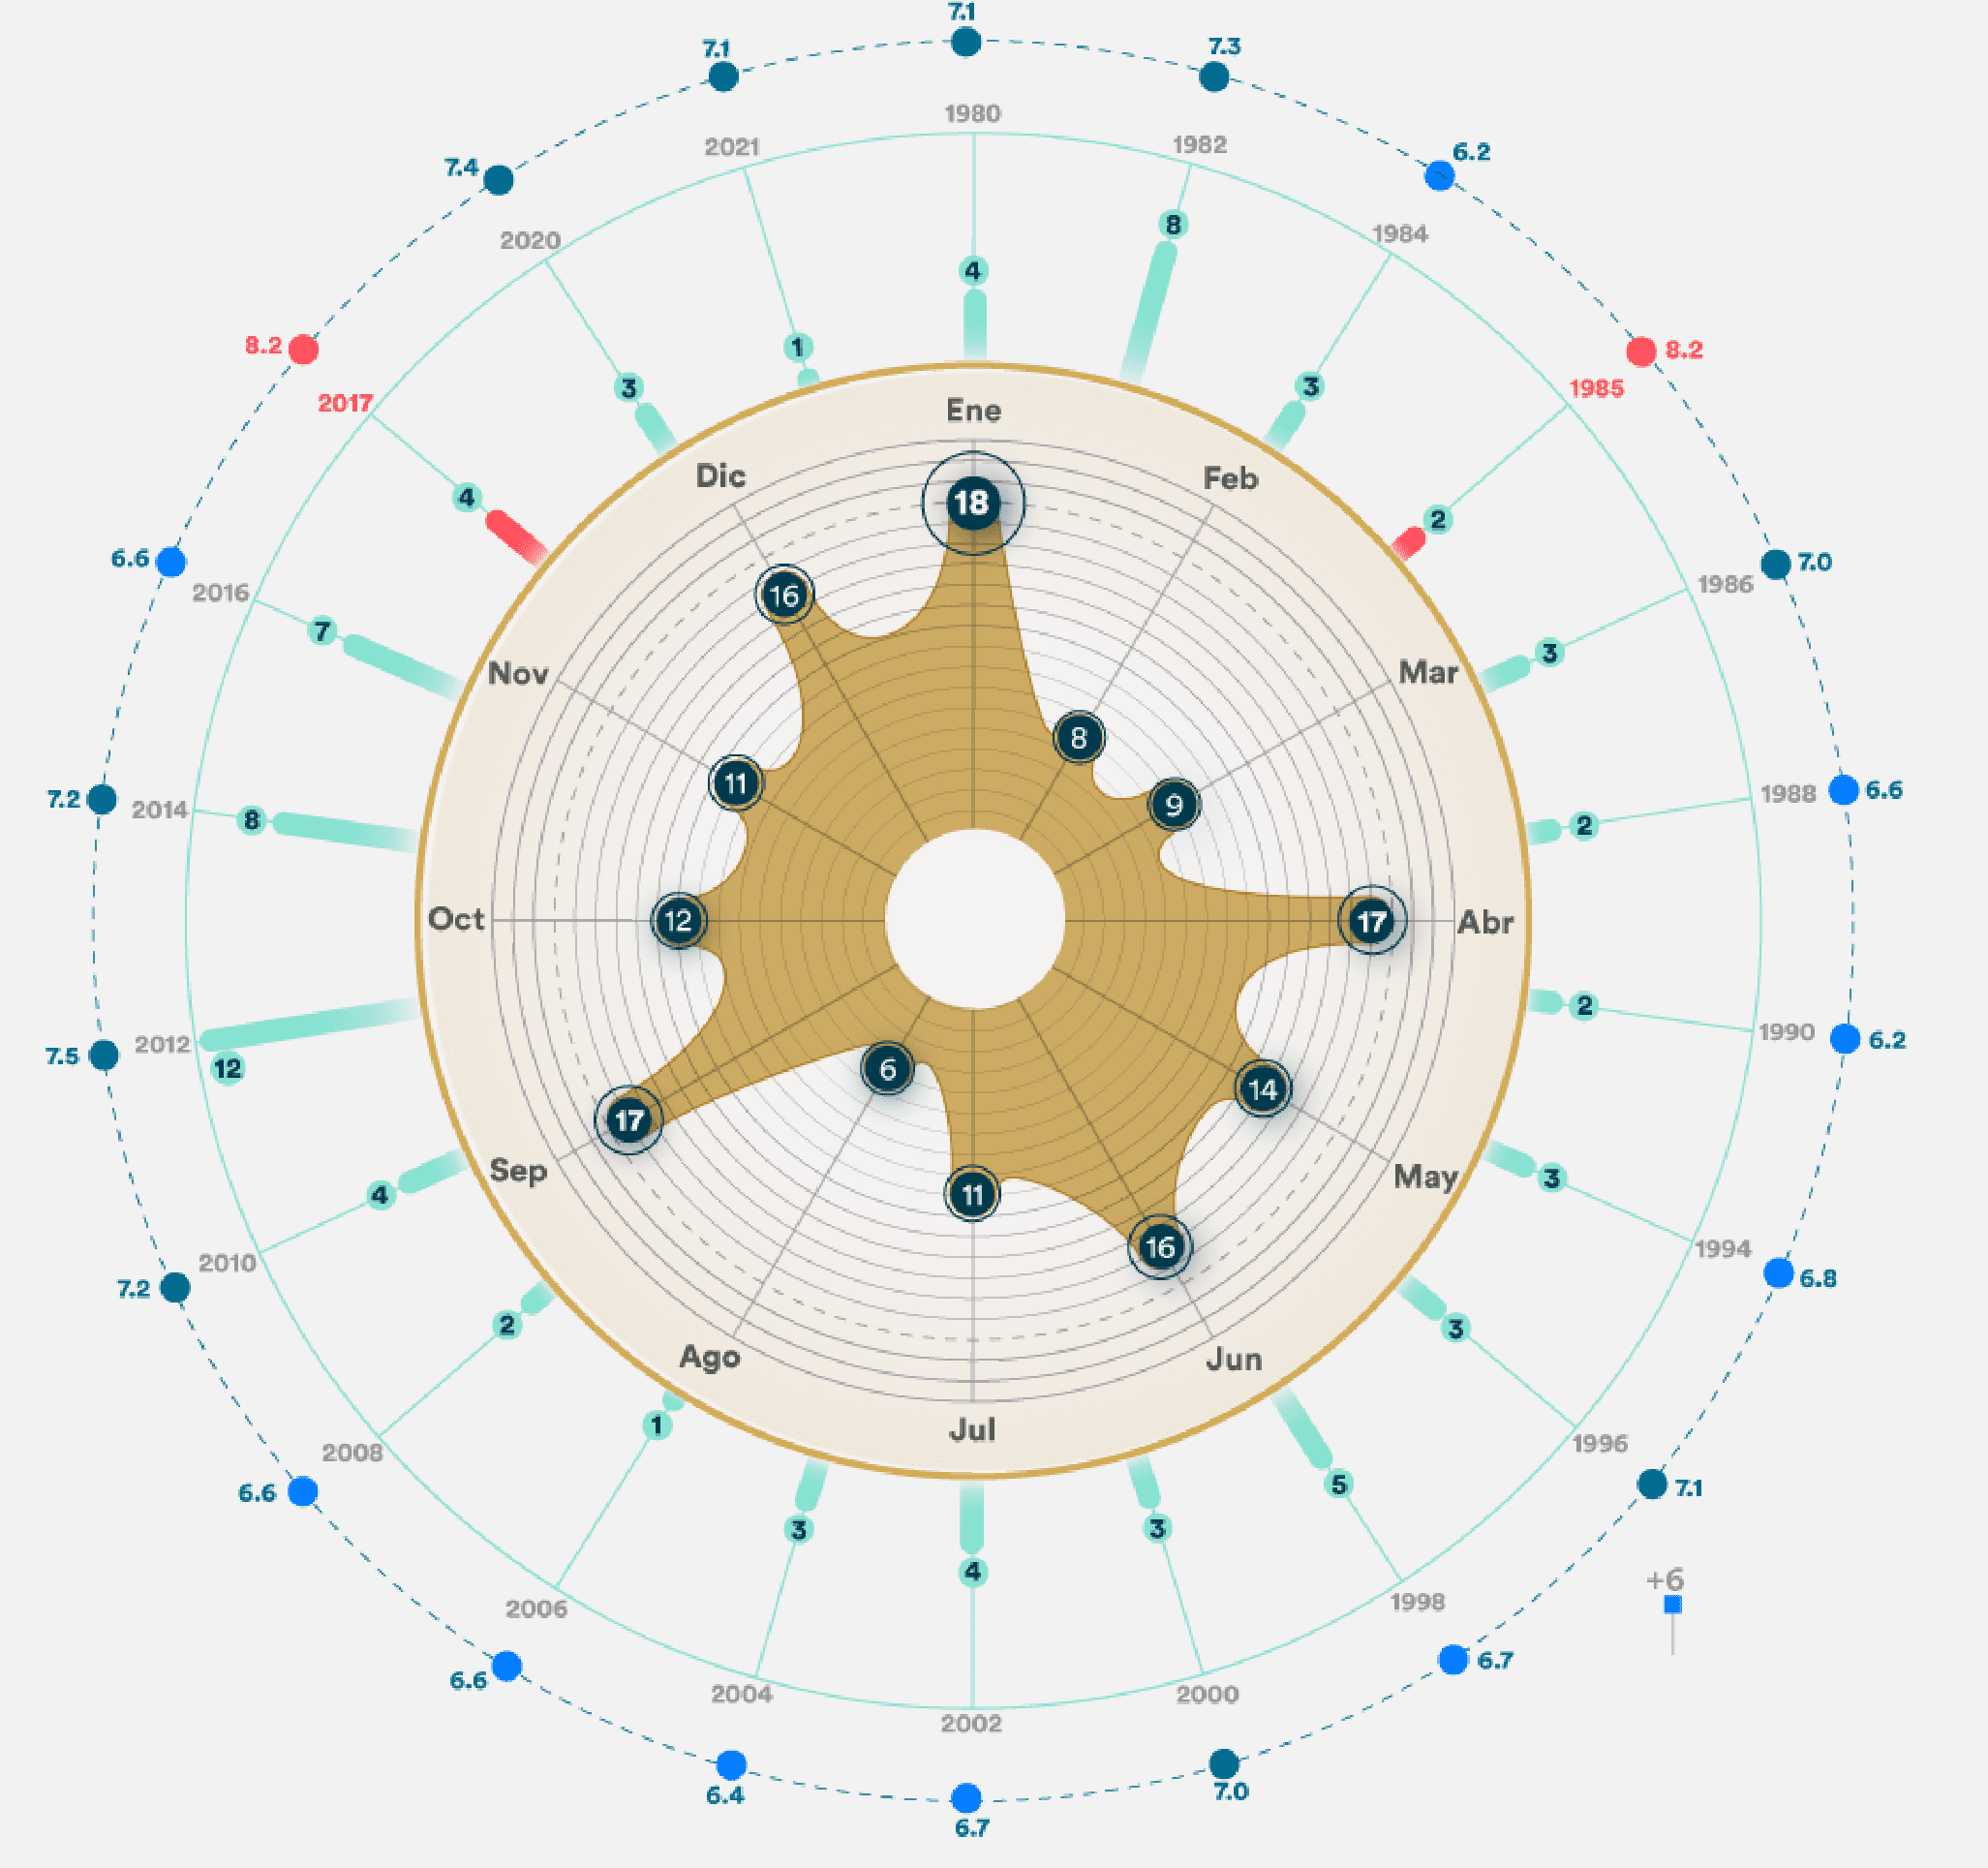
EARTHQUAKES IN MEXICO / X-DATA
We designed a visualization based on data from the National Seismological Service on earthquakes of magnitude greater than 6° that took place between 1980 and 2021 in Mexico, this to refute the idea that September is the month in which the country tremors the most.
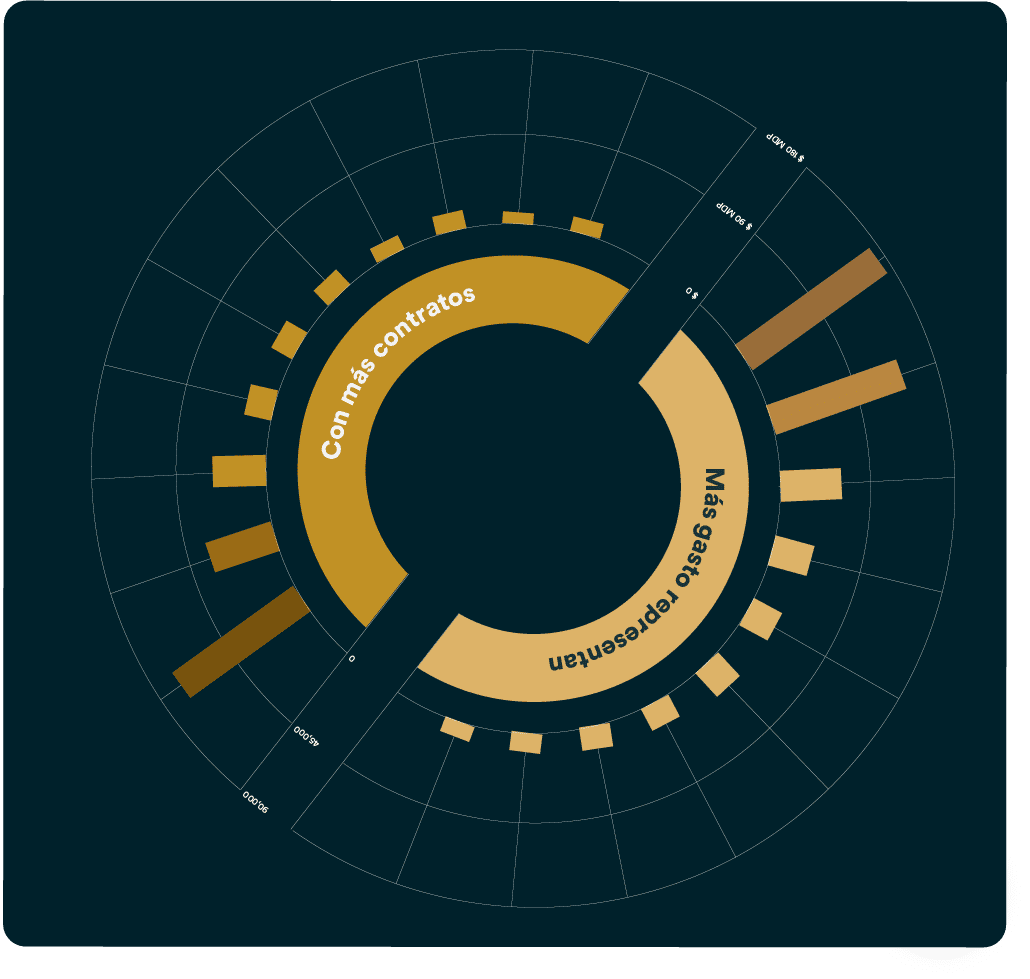
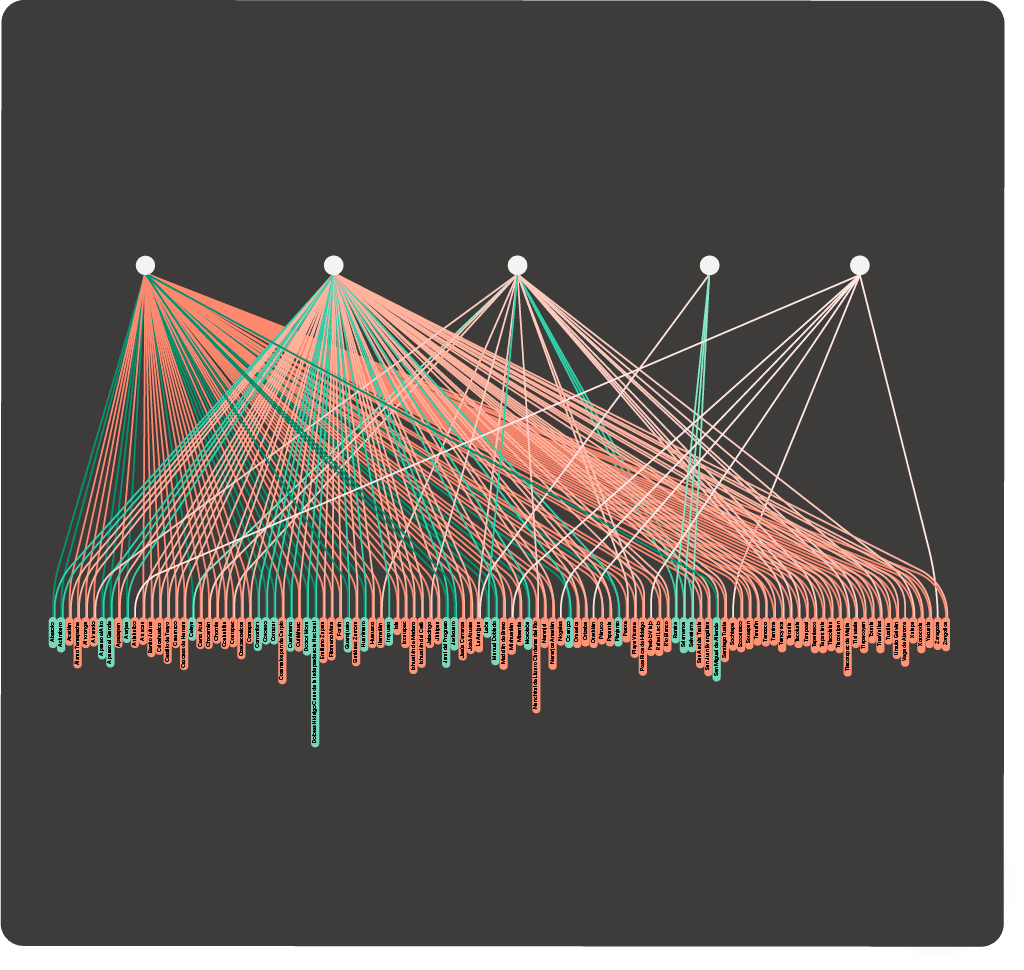
GOVERNMENT CONTRACTS / Milenio
In collaboration with Milenio Televisión, we carry out visualizations about the expenses of the Mexican government during fiscal year 2020. In this way, we identify which contracts, companies, dependencies and institutions represent the most expenses at the national level.
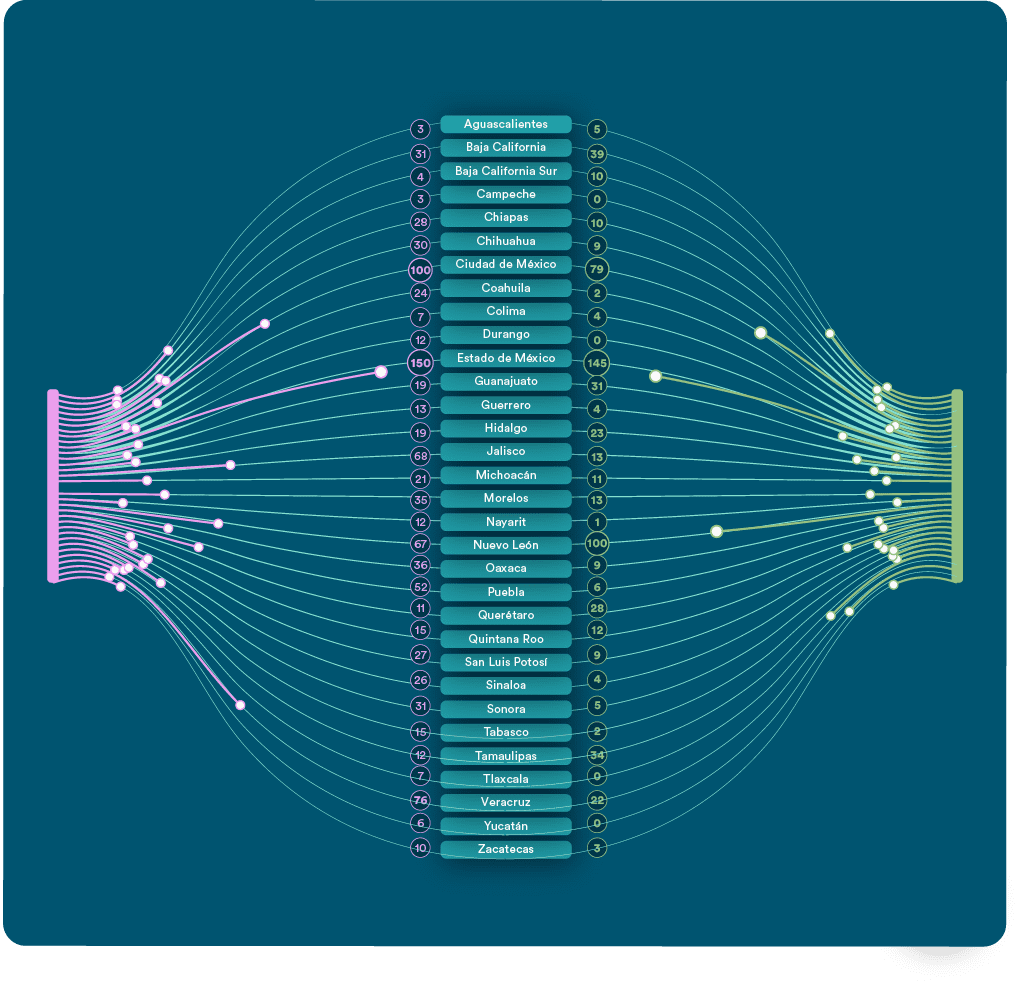
FEMINICIDES VS ABORTION 2020 / X-DATA
We analyze and visualize the number of investigation files generated by crimes prosecuted by the Mexican justice system during 2020, classified as abortion and femicide.
LGBT / CULTURA COLECTIVA
In alliance with Cultura Colectiva we created this visualization based on the journalistic investigation of Gerardo Sánchez Guadarrama about State LGBTIphobia and violence against the diverse community.

EMOTIONS / X-DATA
X-DATA Emotions is our new collection of NFT's based on dataviz that integrates science and data with digital art. A total of 6 NFT's, where thanks to brain mapping, we can visualize how the human brain reacts when feeling different emotions, such as: happiness, fear, surprise, anger, disgust and sadness.

DATA'S FLAVOUR / X-DATA
Dataviz project with artistic focus about mexican gastronomy, where we explore their origin through visualizations about the most representative dishes, desserts and beverages.
EARTHQUAKES IN MEXICO / X-DATA
We designed a visualization based on data from the National Seismological Service on earthquakes of magnitude greater than 6° that took place between 1980 and 2021 in Mexico, this to refute the idea that September is the month in which the country tremors the most.
Contrapedal / X-DATA
We made a platform with D3 visualizations to demonstrate that data analysis and visualization can boost cycling mobility. We created a unique consultation space where all the information necessary to ride safely in CDMX is found.
Government Contracts / Milenio
In collaboration with Milenio Televisión, we carry out visualizations about the expenses of the Mexican government during fiscal year 2020. In this way, we identify which contracts, companies, dependencies and institutions represent the most expenses at the national level.
FEMINICIDES VS ABORTION 2020 / X-DATA
We analyze and visualize the number of investigation files generated by crimes prosecuted by the Mexican justice system during 2020, classified as abortion and femicide
LGBT / CULTURA COLECTIVA
In alliance with Cultura Colectiva we created this visualization based on the journalistic investigation of Gerardo Sánchez Guadarrama about State LGBTIphobia and violence against the diverse community.
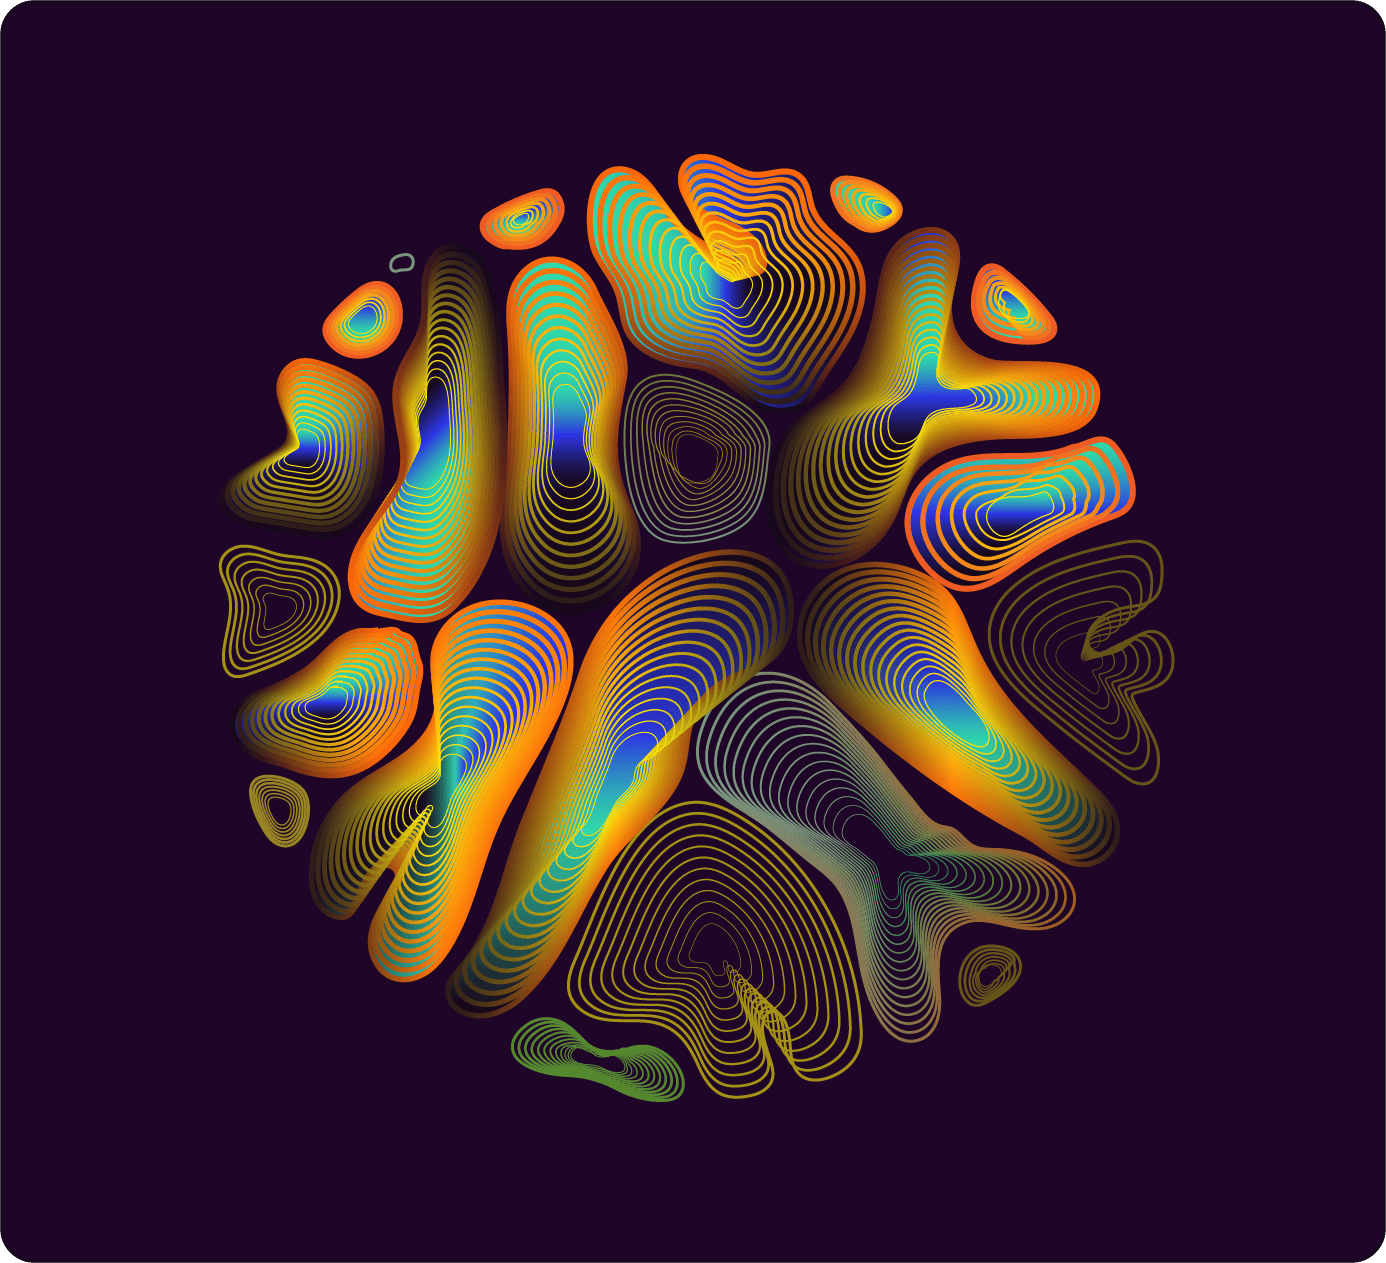
EMOTIONS / X-DATA
X-DATA Emotions is our new collection of NFT's based on dataviz that integrates science and data with digital art. A total of 6 NFT's, where thanks to brain mapping, we can visualize how the human brain reacts when feeling different emotions, such as: happiness, fear, surprise, anger, disgust and sadness.
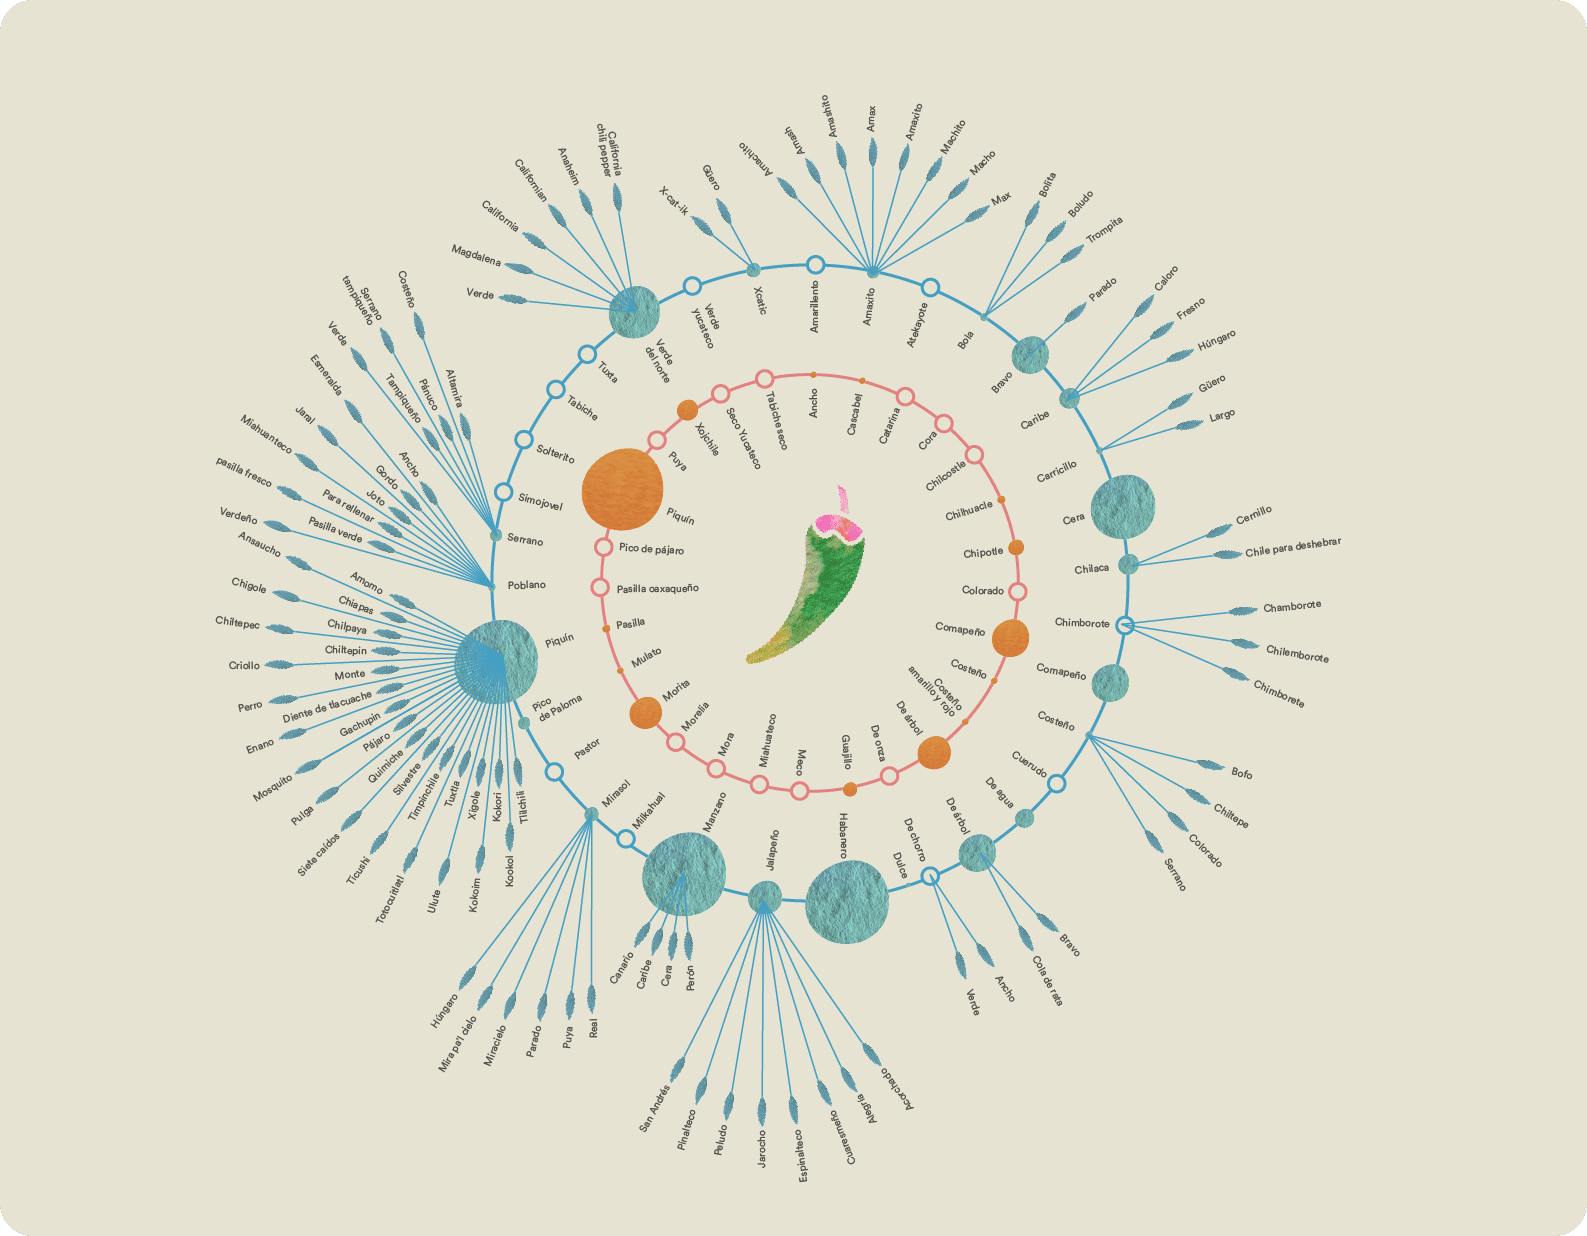
DATA'S FLAVOUR / X-DATA
Dataviz project with artistic focus about mexican gastronomy, where we explore their origin through visualizations about the most representative dishes, desserts and beverages.
Colaboradores
Join the community
Alliance with the leaders
Collaborators


Media

Alliance with the leaders


Alliance with the leaders